As a PMO, I can review the organization projects dashboard
As a PMO, I can review the all projects dashboard.

It shows the following counts :
- Status Reports : It shows the count of all project status reports.
- Proposed Projects : It gives the count for Initiation State.
- Running Projects : It gives the count for Planning and Execution states.
- Closing : It gives the count for Closing state.
- Archived Projects : It gives the count for Archived state.
- Planned Hours : It shows the total planned hours across all projects.
- Approved Hours : It shows the count for Approved hours.
PMO-> Dashboard includes following charts :
- Project States : Shows number of projects in each state (Initiation, Planning, Execution, Closing, and Archived) over the last 6 months.
- Project Reports : **** Shows number of projects based on the status of the last report (green if on track, amber if challenged, red if corrective actions are needed) over the last 6 months.
- Workload : Shows approved hours over the last 6 months. Non-approved hours (in progress, submitted, and rejected) are also displayed.
- Expenses : Shows approved expenses over the last 6 months. Non-approved expenses (in progress, submitted, and rejected) are also displayed.
- Value Distribution : Shows bar chart 5 columns according to the project value.
- Size Distribution : Shows bar chart 6 columns according to the project sizes (XS, S, M, L, XL, XXL)
- Schedule Performance : Shows bar chart 5 columns [ Early >20%, Early (10-20%), On Schedule, Late (10-20%), Late >20% ].
- Cost Performance : Shows bar chart 5 columns [Under Budget > 20%, Under Budget 10-20%, On Budget, Over Budget 10-20%, Over Budget > 20% ].
- Size vs. Value Distribution : Shows heatmap chart [(Small, Medium, Large) x (Low Value, Medium Value, High Value) ].
- Cost vs. Schedule Performance : Shows heatmap chart [ (Over Budget, On Budget, Under Budget) x (Late, On Schedule, Early) ]
- Projects per Type : Shows last 6 months records according to the project types.
- Projects per Phase : Shows last 6 months records according to the project phases.
- Risks : Shows the donut chart according to the risks sectors (Watch List, White, Red, Amber, Green, Closed]
- Issues : Shows the donut chart according to the priorities (Low, Medium, High, Closed].
- Feedback : Shows the donut chart according to the project feedback index.[1, 2, 3, 4, 5].
- Happiness Index : Shows line chart according to last 6 months of happiness index records.
- Comments : Shows the donut chart according to the comments by stakeholders, by team members and by the management team. [ Read comments and Unread comments].
- Changes : Shows the donut chart according to the changes statuses done by stakeholders and by the management team. [ In Progress, Approved, Rejected].
- Top 10 Projects by Work : Shows bar graph for approved works of top 10 projects. ****
- Top 10 Projects by Expenses : Shows bar graph for expenses of top 10 projects. ****
- Top 10 Projects by Duration : Shows bar graph for the duration of top 10 projects. ****
- Top 10 Projects by Budget : Shows bar graph for budgets of top 10 projects.
As a PMO, I can see the dashboard for all Business Units by switching on the toggle ‘Show all Business Units’.

As a PMO, I can see the dashboard for archived projects by switching on the toggle ‘Showing Archived Projects’.

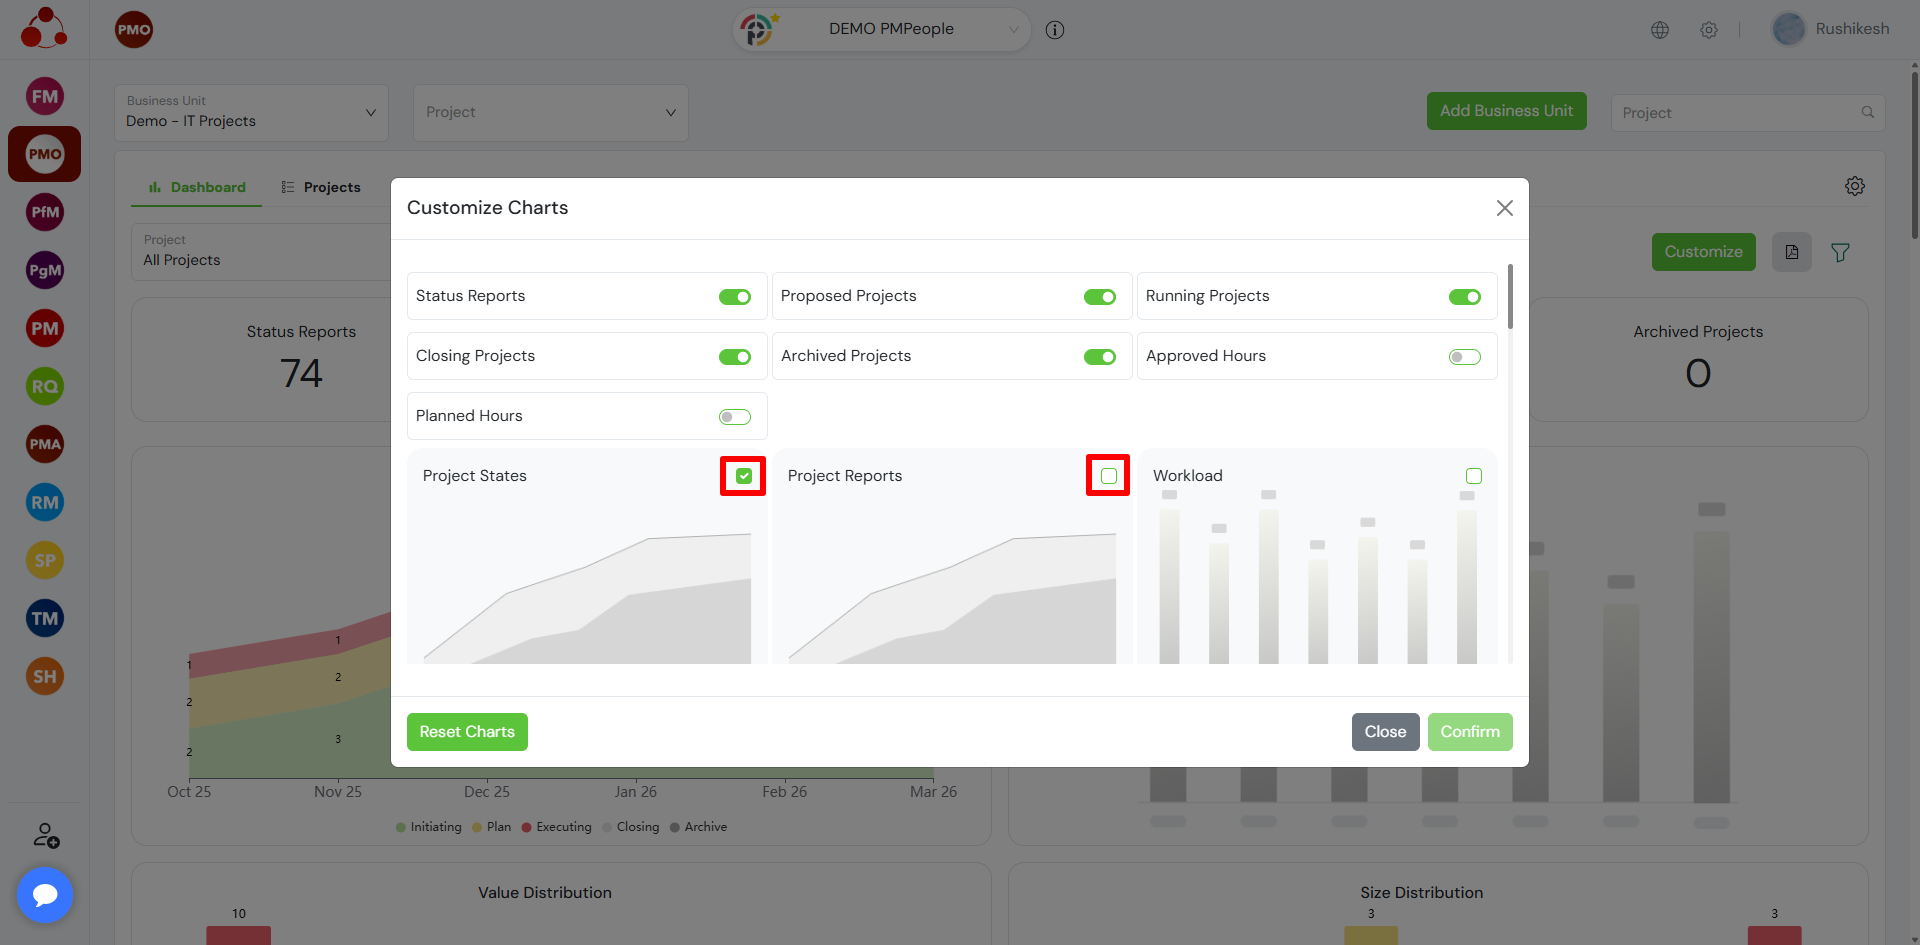
By using the ‘Customize’ button, PMO can add or remove charts and Project Metrics.
Users can download a pdf by clicking on the ‘PDF’ icon.

Users can maximize or minimize the charts.

Users can filter the charts.

Users can check the dashboard for a specific project when ‘Show all Business Units’ toggle is off.


Frequently Asked Questions
Who can access the organization projects dashboard in PMPeople?
PMOs have full access to the organization projects dashboard. Depending on permissions, other managers such as PfMs and PgMs may also view the dashboard.
What types of charts are available on the PMO dashboard?
The dashboard includes charts for Project States, Project Reports (traffic light status), Workload, Expenses, Value & Size Distribution, Schedule and Cost Performance, Risks, Issues, Feedback, Happiness Index, Comments, Changes, and Top 10 Projects by Work, Expenses, Duration, and Budget.
Can the PMO customize or export the dashboard?
Yes. The PMO can customize the dashboard by adding or removing charts using the ‘Customize’ button. Charts can be filtered, maximized, or minimized. A PDF version of the dashboard can be downloaded using the ‘PDF’ icon.
Can the dashboard show data for archived projects or all business units?
Yes. By toggling ‘Show all Business Units’, PMOs can view data across all business units. Similarly, by enabling ‘Showing Archived Projects’, archived projects can be included in the dashboard views.